.jpg)
.jpg)
.jpg)
.jpeg)
.png)
.png)
.png)
.png)
.png)
.jpeg)
.jpeg)
.jpeg)
%2520(1).png)


.avif)


.png)

.png)
.png)


.png)
![Agent Server [1/3]: Where Enterprise AI Agents Live, Work, and Scale](https://cdn.prod.website-files.com/67bef0c56c3781a827a0f375/69c14b6f967d2ae5279adcea_690e4d0f068d3ec27aea7ae0_123%2520(1).png)
![Agent Server [2/3]: Where Should Your Agent Server Run?](https://cdn.prod.website-files.com/67bef0c56c3781a827a0f375/69c14b6f967d2ae5279adcf0_690e646b6e0366d090fbc37f_wdxczxgr-1.png)
![Agent Server [3/3]: Agent Access Control Explained: RBAC, Caller Limits, and Safer A2A](https://cdn.prod.website-files.com/67bef0c56c3781a827a0f375/69c14b56c87a1735a82bac8d_69132a45740300abc320bc7f_Cover_%2520RBAC%2520for%2520Agents%252C%2520Done%2520Right2%2520(1).png)
.png)
.jpeg)
.png)
%25201%2520(1).jpeg)

%25201%2520(1).jpeg)
.jpeg)
.jpeg)
July 21, 2026
A Living Memory of Your Enterprise Context — The Genesis Context Graph
.jpg)
TL;DR: A 15% revenue discrepancy on a Tuesday morning dashboard used to mean a six-hour investigation across tables, pipelines, and integrations. Genesis Twin collapses that into five minutes by letting engineers navigate four levels of data context, from dashboard to root cause, without switching tools or reconstructing tribal knowledge.
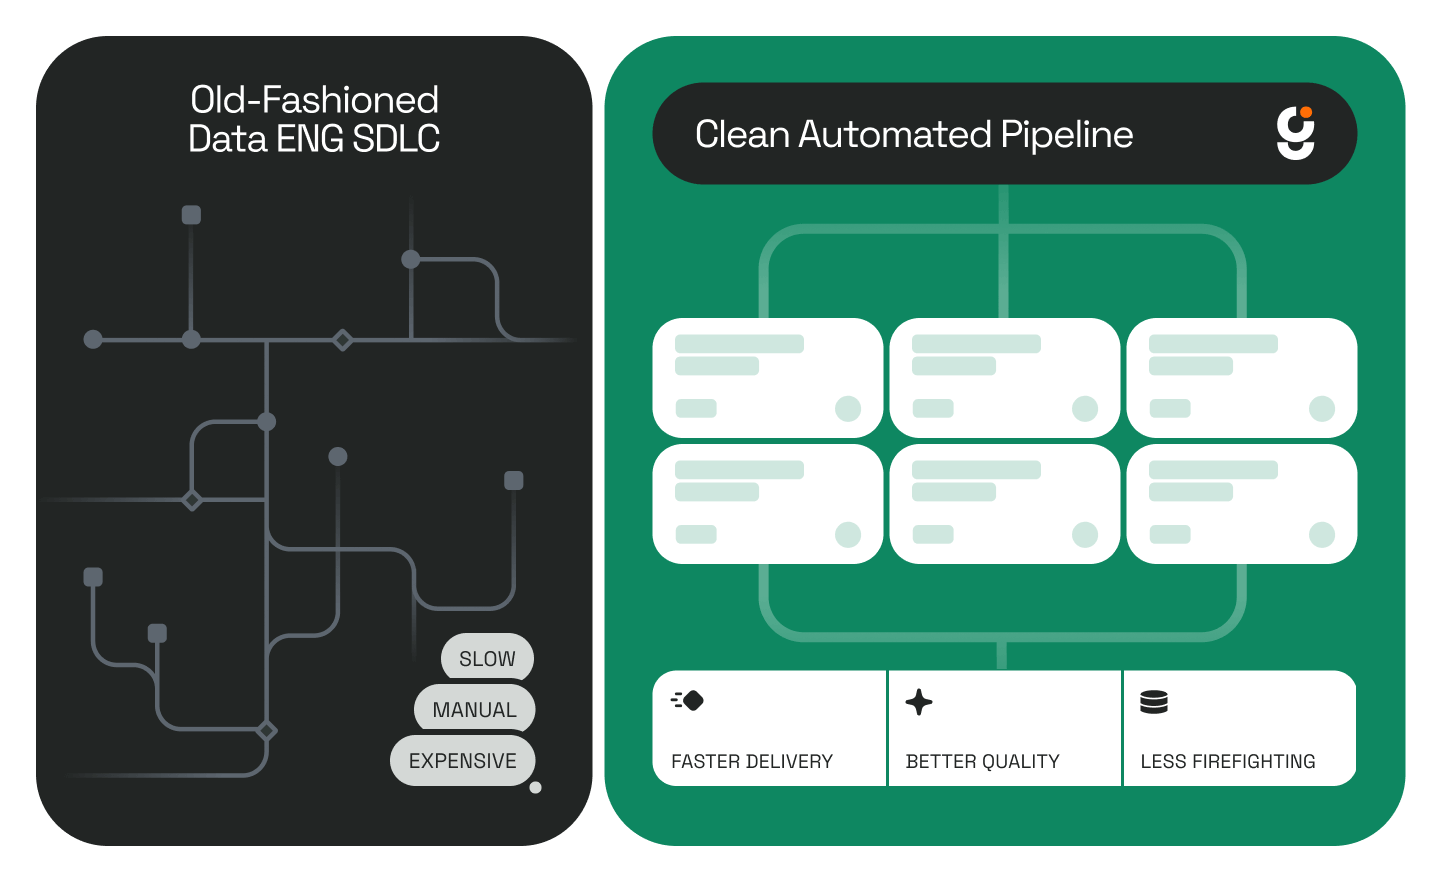
It's Tuesday morning after the largest snowstorm since 2016. Your dashboard is showing weird numbers. Revenue is off by 15%.
Here's how that investigation used to go:
Six hours. Probably more than one engineer. All to trace a change that took seconds to make and seconds to confirm once you knew where to look.
This is the data pipeline debugging reality for most teams. According to Integrate.io's analysis of ETL error handling and monitoring benchmarks, 68% of data teams need four or more hours to detect pipeline issues, with the average time to resolve climbing to 15 hours. The problem isn't speed. It's the absence of a map.
Genesis's Context Graph solves this by giving engineers a layered, navigable view of their entire data environment. When the revenue number looks wrong, you don't start digging blindly. You zoom.
Asset Level: The dashboard is querying the REVENUE_SUMMARY table. The total_sales column looks wrong.
Collection Level: REVENUE_SUMMARY is part of the "Sales Analytics" dataset, fed by three upstream sources.
Container Level: One of those sources is the SALESFORCE_SYNC schema. When did that last update?
System Level: The Salesforce-to-Snowflake connector version changed. That's the break.
Five minutes. Four zoom levels. Root cause identified.
This is the same contextual map that makes it possible for Genesis agents to reverse-engineer an entire legacy data warehouse in 40 minutes, and the same infrastructure layer that powers Genesis Context Graph real-time dependency mapping. The context view is not a reporting tool, it's what makes fast, accurate work possible in the first place.
Data engineers debugging at 5 AM don't need a six-Slack-thread investigation. They need a direct path from symptom to source. Genesis's context graph provides it.
Platform leaders planning migrations need to see both which systems are involved and which specific tables will break, without switching between tools. The four-level hierarchy gives them both views simultaneously.
CDOs explaining data architecture to a board need to zoom out to system-level dependencies without drowning executives in table schemas. Twin's hierarchy makes that possible without preparation.
As Atlassian notes in their incident management metrics guide, there is a strong correlation between resolution time and customer satisfaction. For data teams, that means every hour spent in a manual root cause investigation is an hour of eroded trust in the numbers stakeholders rely on.
What is data lineage and why does it matter for debugging? Data lineage is the documented path data takes from its source through transformations to its final destination. Without it, tracing a broken metric means manually checking every system in the chain. With it, you follow the path directly to the break.
What is the difference between Asset, Collection, Container, and System levels? These are four tiers of context in Genesis's context graph. Assets are individual tables or columns. Collections are datasets made up of multiple assets. Containers are schemas or data sources. Systems are the top-level integrations, like a Salesforce-to-Snowflake connector. Navigating these levels lets you move from a wrong number on a dashboard to its root cause without losing context.
How is Genesis Context Graph cdifferent from standard data observability tools? Most observability tools alert you that something is wrong. Genesis's Context Graph shows you why, by mapping the full dependency chain so you can trace the issue rather than just detect it.
Does Genesis's context graph work across cloud and on-premise systems? Yes. the context graph maps across common enterprise stacks regardless of where systems live. See the full details on the Genesis Computing blog.


.jpg)
.jpg)
.jpg)