


.jpg)
.jpg)
.jpg)
.jpeg)
.png)
.png)
.png)
.png)
.png)
.jpeg)
.jpeg)
.jpeg)
%2520(1).png)


.avif)


.png)

.png)
.png)


.png)
![Agent Server [1/3]: Where Enterprise AI Agents Live, Work, and Scale](https://cdn.prod.website-files.com/67bef0c56c3781a827a0f375/69c14b6f967d2ae5279adcea_690e4d0f068d3ec27aea7ae0_123%2520(1).png)
![Agent Server [2/3]: Where Should Your Agent Server Run?](https://cdn.prod.website-files.com/67bef0c56c3781a827a0f375/69c14b6f967d2ae5279adcf0_690e646b6e0366d090fbc37f_wdxczxgr-1.png)
![Agent Server [3/3]: Agent Access Control Explained: RBAC, Caller Limits, and Safer A2A](https://cdn.prod.website-files.com/67bef0c56c3781a827a0f375/69c14b56c87a1735a82bac8d_69132a45740300abc320bc7f_Cover_%2520RBAC%2520for%2520Agents%252C%2520Done%2520Right2%2520(1).png)
.png)
.jpeg)
.png)
%25201%2520(1).jpeg)

%25201%2520(1).jpeg)
.jpeg)
.jpeg)
July 21, 2026
A Living Memory of Your Enterprise Context — The Genesis Context Graph
.jpg)

TL;DR: Healthcare data teams typically spend weeks turning raw claims data into usable analytics. A recent test pairing Genesis Eve with Claude Code collapsed that timeline to 7 minutes, going from 1,000 scattered medical claims to a fully deployed, interactive analytics dashboard.
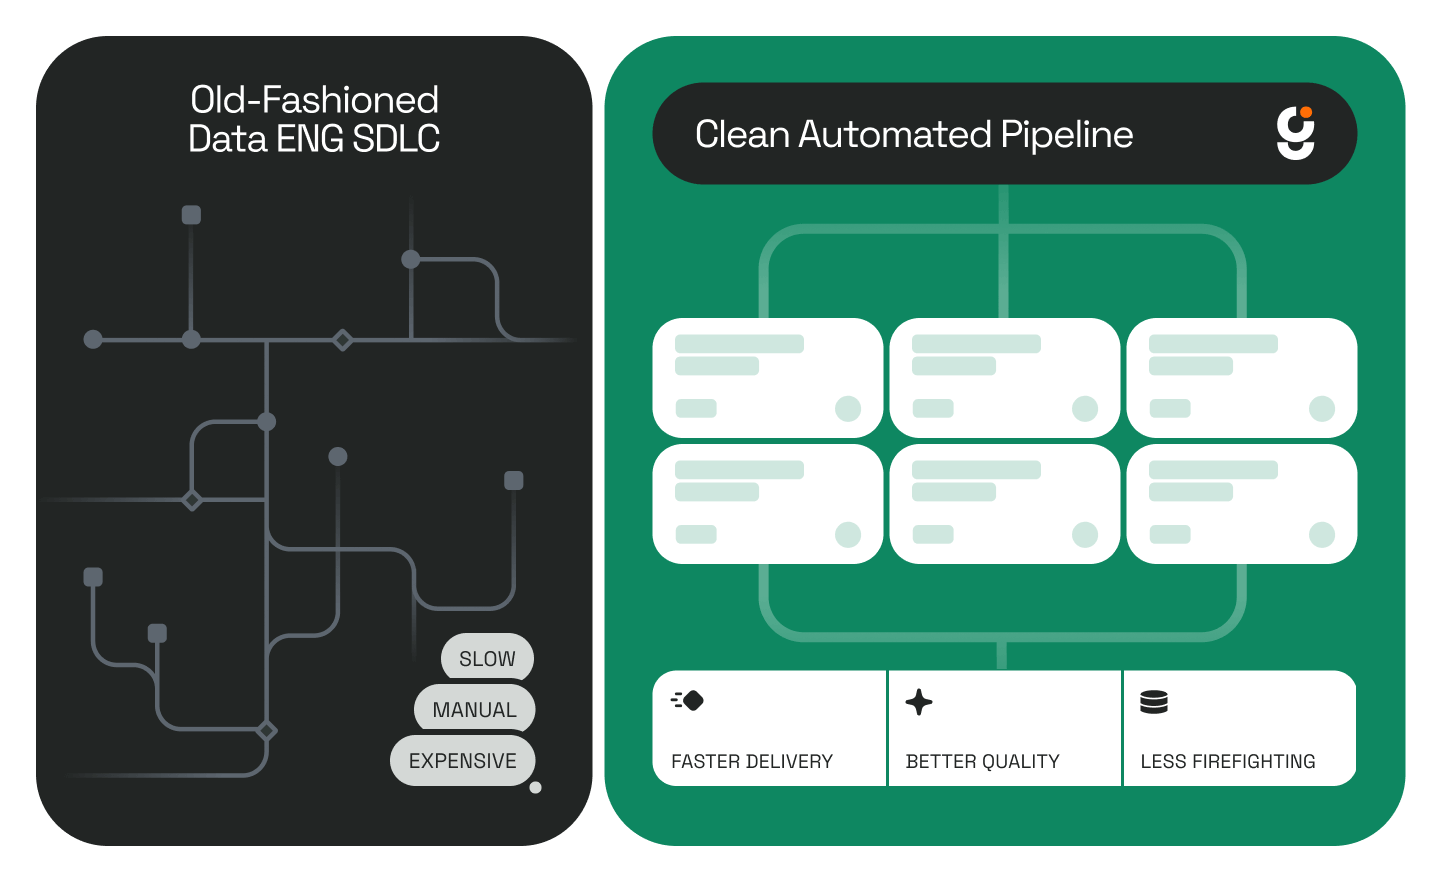
Ask any healthcare data team what claims analysis looks like in practice, and you'll hear the same story. Weeks profiling data across multiple tables. Days building models. More days designing dashboards. Then deployment cycles, debugging, and starting over when requirements shift.
The backlog never really shrinks, it just changes shape.
That's not a people problem. It's a workflow problem. That’s not a people problem. It’s a workflow problem. And it’s exactly the kind of problem explored in Genesis Computing’s perspective on modern analytics workflows.
Genesis Eve, an autonomous analytics agent, was paired with Anthropic's Claude Code to work through a real-world scenario: take 1,000 medical claims spread across 5 separate tables and produce a production-ready analytics dashboard.
The result was delivered in 7 minutes.
Here's how the process broke down:
Eve didn't just ingest the data, it surfaced the story inside it. Before a single line of dashboard code was written, the agent identified key patterns that analysts would typically spend days finding:
These aren't vanity metrics. A 17.5% specialist denial rate versus a 6.1% hospital rate is a significant operational signal that affects revenue, patient care, and administrative workload.
With the data profiled, Eve designed the analytics model and handed Claude Code a precise specification:
Claude Code built the application from the spec. Eve then validated the output, ran health checks, and deployed it as a live web application.
Start to finish: 7 minutes.
Healthcare data teams deal with enormous volumes of claims data that span multiple systems, payers, and time periods. The traditional path from raw data to actionable insight is long because each step requires human judgment, context-switching, and coordination.
What this workflow demonstrates is that autonomous analytics is possible. That means raw data going directly to an actionable dashboard, without the multi-week workflow in between.
The coordination between tools matters here. Eve understood the context of the data and what questions the dashboard needed to answer. Claude Code handled the implementation. Those are two different types of work, and the two tools divided them correctly.
This isn't about replacing analysts. It's about removing the slow parts of the process so analysts can focus on interpretation and decision-making rather than data plumbing.
Backlogs in analytics teams don't shrink because people work faster. They shrink when high-quality outputs can be produced autonomously. A single analyst can only do so much manual work per day. An agent that can profile data, design a model, build a dashboard, and deploy it in 7 minutes changes the math entirely.
The Eve and Claude Code experiment is a concrete example of what's possible when purpose-built agents handle different parts of a complex workflow. For healthcare specifically, where data complexity is high and analytical needs are urgent, this kind of speed is meaningful.
A 13.5% denial rate buried in a 5-table dataset is a problem. An insight surfaced in minutes that leads to action is a solution.
What is Genesis Eve? Genesis Eve is an autonomous analytics agent designed to profile, model, and interpret complex datasets. In this example, it acted as the analytical intelligence layer, understanding the data context before handing off to a code execution tool.
What is Claude Code? Claude Code is Anthropic's command-line tool for agentic coding. It takes structured specifications and builds functional applications from them. In this workflow, it received Eve's analytics spec and produced a working Plotly Dash dashboard.
Can this approach work with real production healthcare data? The demonstration used 1,000 synthetic claims across 5 tables. Real production environments involve larger datasets, stricter data governance requirements, and integration with existing systems. That said, the core workflow, profiling, modeling, building, and deploying, applies regardless of data volume.
What is Plotly Dash? Plotly Dash is an open-source Python framework for building analytical web applications. It's widely used in data science and healthcare analytics for creating interactive dashboards without extensive front-end development.
Is this replacing healthcare data analysts? No. The workflow handles the time-consuming mechanical steps of claims analysis. Analysts are still needed to interpret findings, validate outputs, and make decisions. The goal is to reduce the backlog and accelerate the path from raw data to insight.
What does a denial rate of 17.5% for specialists mean? It means that 17.5% of claims submitted by specialist providers were denied. Compared to a 6.1% denial rate for hospitals, this gap often points to documentation issues, coding discrepancies, or payer policy differences that revenue cycle teams need to address.

.jpg)
.jpg)
.jpg)