https://genesis-f5c225.webflow.io/use-cases/context-graph#lineage-examples

Trace the data. Find the root cause.

When reports disagree or metrics shift, Genesis traces data lineage across source feeds, transformations, and dataset versions to pinpoint what changed. Verify corrections with Prover and give your team the evidence to resolve the issue with confidence.
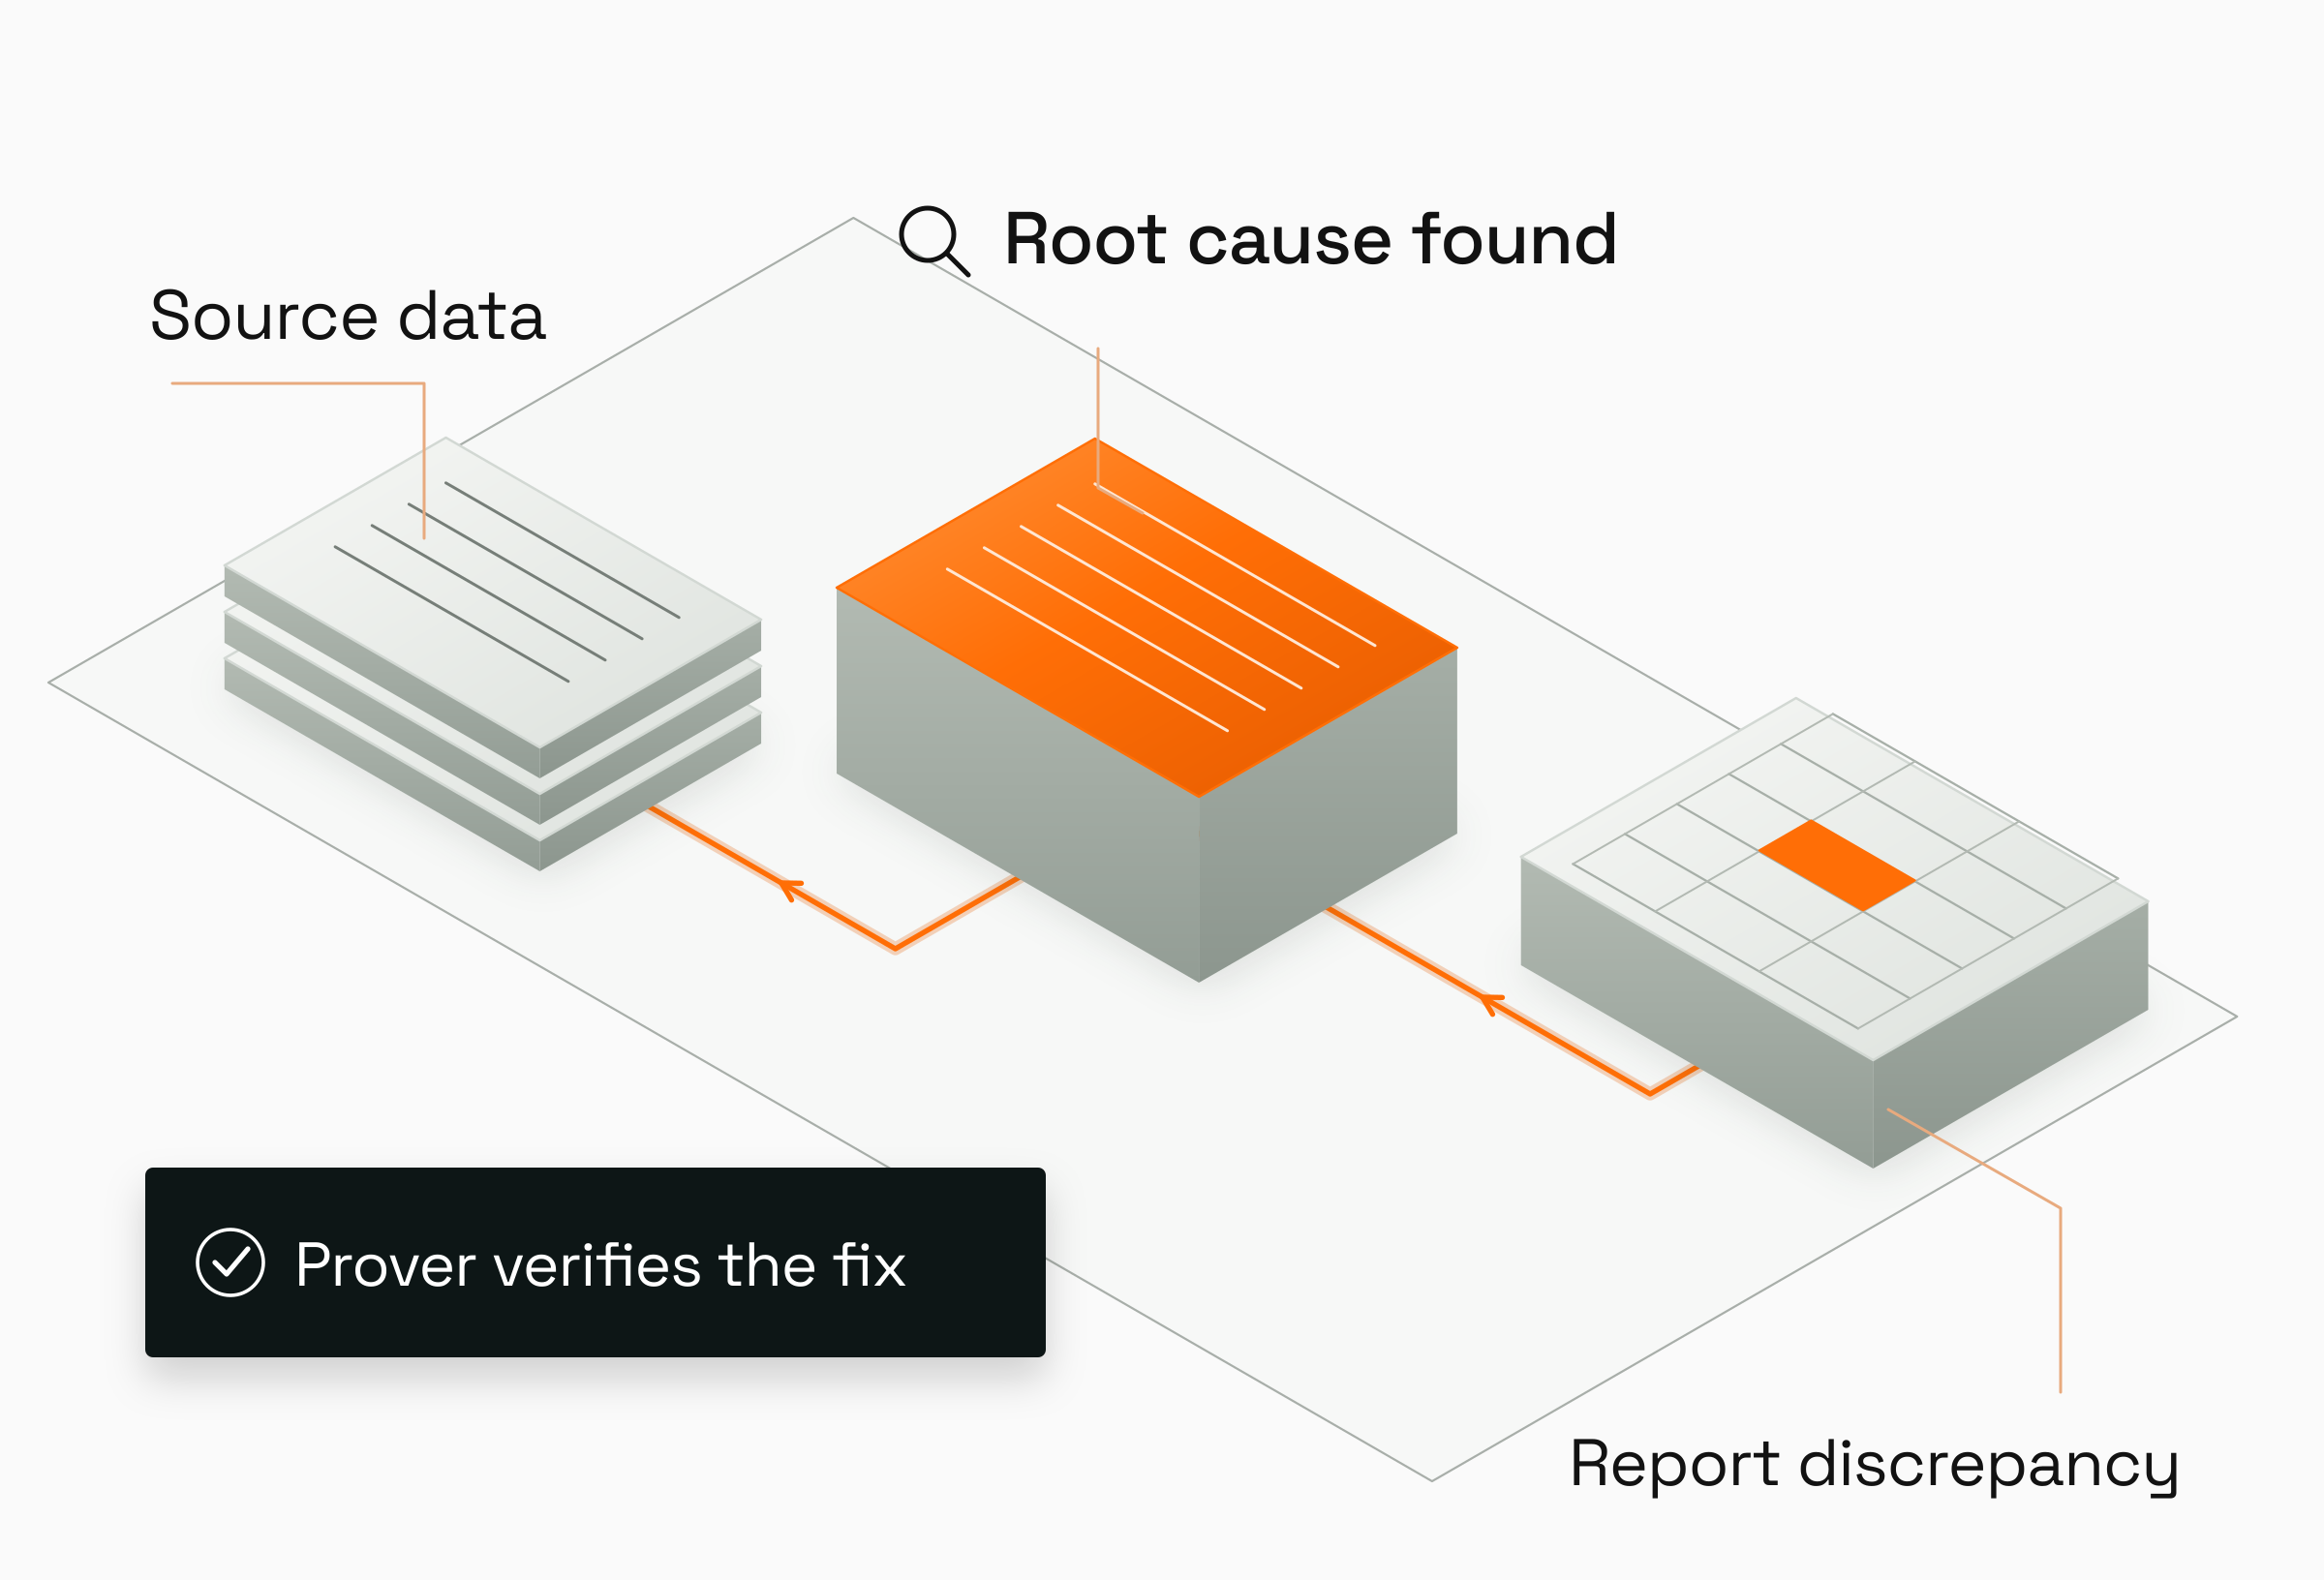
A report discrepancy is traced through data transformations to an orange-highlighted root cause, followed by Prover verification.

DATA LINEAGE & ROOT CAUSE ANALYSIS

Find the break. Explain the cause. Verify the resolution.

When a critical number does not reconcile, Genesis follows the data to explain what changed. Explore a cross-industry workflow and four industry examples that connect source-level findings to a verified correction or an informed decision, with evidence your team can review.

EVERY INDUSTRY / MODERN DATA STACK

Find the source change behind a broken dashboard

Problem

A revenue dashboard shows missing or unknown deal stages. The break may start in Salesforce, replication, lakehouse tables, or dbt. The same upstream change can also affect other dashboards, ML features, board reporting, and finance close.

Solution

Genesis traces the dashboard across the stack to a renamed Salesforce field, maps 15 additional affected assets, and prioritizes an authorized remediation plan. It updates dependent models and refreshes downstream assets, then uses Prover to verify recovery and retain the incident evidence.

Genesis traces a Tableau dashboard through dbt, a lakehouse, and Fivetran to a renamed Salesforce field. Databricks and Snowflake appear as equal alternatives in one lakehouse layer. Fifteen additional assets are mapped: four dbt models, seven dashboards, two ML notebooks, one board pack, and one finance report. Authorized fixes are followed by Prover verification.
One dashboard alert reveals the source change and the wider downstream impact. The same workflow applies across industries. Illustrative scenario.
Enlarge diagram

Results

1 alerttraced across the stack
15 assetsadditional impacts addressed
Proverrecovery verified

WORKFLOWS BY INDUSTRY

BANKING / REGULATORY REPORTING

Trace a capital-ratio break before the filing deadline

Problem

The regulatory report shows an 11.6% Tier 1 capital ratio; the risk system shows 12.0%. With 48 hours to filing, finance and risk teams need to explain the 40-basis-point gap across six layers of data and calculations.

Solution

Genesis traces the report back through the aggregation model, risk mart, and source feeds. It isolates a missing product mapping that left $780M of exposures misclassified after a corporate action, applies the authorized correction, and uses Prover to verify the reconciliation for CFO review.

A 40-basis-point capital-ratio break leads to a six-layer aggregation tower. Genesis highlights the exposure classification layer, where a missing product mapping affects $780 million of exposures. The corrected ratio is 12.0%, with less than one basis point residual and Prover evidence for CFO review.
Report to source feed: isolate the classification break, verify the correction, and retain the reconciliation evidence. Illustrative scenario.
Enlarge diagram

Results

40bp to <1bpreconciliation residual
6 layerstraced to the source
CFO-readyreconciliation evidence

HEALTH PLANS / QUALITY REPORTING

Explain a quality-measure drop before submission

Problem

A diabetes quality measure falls from 82% to 74% two weeks before CMS submission. Claims, labs, pharmacy, eligibility, and coding rules all feed the calculation, leaving the quality team to find what changed and which members were affected.

Solution

Genesis correlates the five sources on one timeline. It finds a lab vendor’s LOINC code change that the measure rule did not recognize, affecting 6,300 members. After the authorized mapping update, the measure recalculates to 82.4%, with Prover evidence and a change log for quality and audit review.

Five source timelines show stable claims, pharmacy and eligibility data, with an August 15 lab-code change linked to a September measure drop. LOINC changes from 4548-4 to 17856-6; 6,300 members are affected. Updating the measure rule restores the illustrative rate from 74% to 82.4%.
A shared timeline connects the lab-code change to the measure drop, making the affected members and correction clear. Illustrative scenario.
Enlarge diagram

Results

82.4%restored measure rate
6,300members correctly counted
5 sourcescorrelated on one timeline

CAPITAL MARKETS / QUARTER-END CLOSE

Find stale prices behind a quarter-end P&L break

Problem

The fixed-income desk’s P&L differs from the general ledger by $27M, with 36 hours to the earnings release. Teams must compare positions, market data, FX, corporate actions, reference data, and trade bookings against the same cutoff.

Solution

Genesis aligns all six feeds to the 15:30:00.000 ET position snapshot. It finds stale prices for 47 structured-credit instruments, refreshes the affected records under the agreed authorization, and reruns the reconciliation. Prover verifies a $4.7K residual with timestamp evidence for finance and auditors.

Six trading feed lanes align to a 15:30:00.000 ET cutoff. Market data ticks between 14:32 and 15:19 are highlighted as 11 to 58 minutes stale, affecting 47 instruments. Correcting the prices reduces a $27 million P&L break to a $4.7 thousand residual.
The common cutoff makes stale market data visible. Corrected prices close the break with a traceable evidence package. Illustrative scenario.
Enlarge diagram

Results

$27M to $4.7Kunreconciled P&L
47instruments corrected
6 feedschecked against one cutoff

LIFE SCIENCES / CLINICAL SUBMISSION

Explain a patient-count mismatch across study snapshots

Problem

The clinical study report uses N=852 while the submission analysis dataset uses N=847. With 48 hours to filing, the team needs to explain the five-patient difference and identify which records changed after the report’s data lock.

Solution

Genesis compares the versioned lineage from analysis datasets through SDTM, EDC extracts, and patient forms. It identifies five late corrections at two sites and presents two documented paths: use the report’s snapshot or amend the report. Regulatory affairs chooses the path, supported by provenance and Prover reproducibility evidence.

Parallel September 15 CSR and September 20 submission snapshot stacks show patient counts of 852 and 847. The comparison traces ADaM, SDTM, EDC and patient forms to five late corrections at Sites 042 and 019. Regulatory affairs can align the submission to the CSR snapshot or amend the CSR, with versioned provenance and reproducibility evidence.
Compare the snapshots, explain the late corrections, and give regulatory affairs an evidence-backed choice of resolution. Illustrative scenario.
Enlarge diagram

Results

5 patientsexplained across snapshots
2 siteswith late corrections
Traceablesnapshot provenance

Workflow diagram

Key features

A Shared Foundation for People and Agents

Key features

A Shared Foundation for People and Agents

Estate Discovery

Map the data assets and code within the sources you enable.

Dependency Analysis

Trace upstream sources and downstream consumers before a change.

Agent Grounding

Give agents relevant estate context for the task they are assigned.

Controlled Scan Scope

Choose which sources are scanned and when context is refreshed.

Engineering Lineage

Connect agent-created work to the data assets and workflows it uses.

Frequently Asked Questions

Genesis logo